-
Latham Hi‑Tech Seeds
Create a Planting Layer in Climate FieldView™
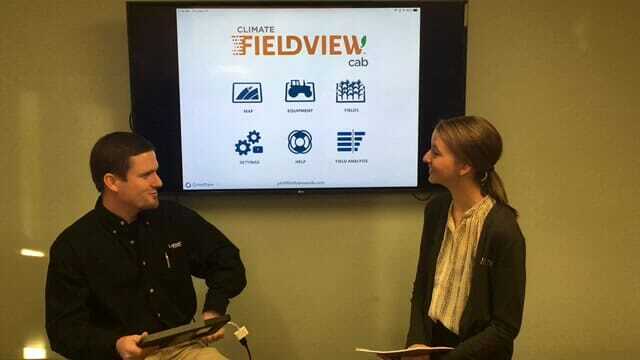
Join us this morning for a live tutorial on how to create a planting layer in Climate FieldView™ after harvest! Learn ways to analyze yield by variety.
https://www.facebook.com/LathamSeeds/videos/1767875733339923/
-
Latham Hi‑Tech Seeds
Climate FieldView™ Cab App features to try during harvest
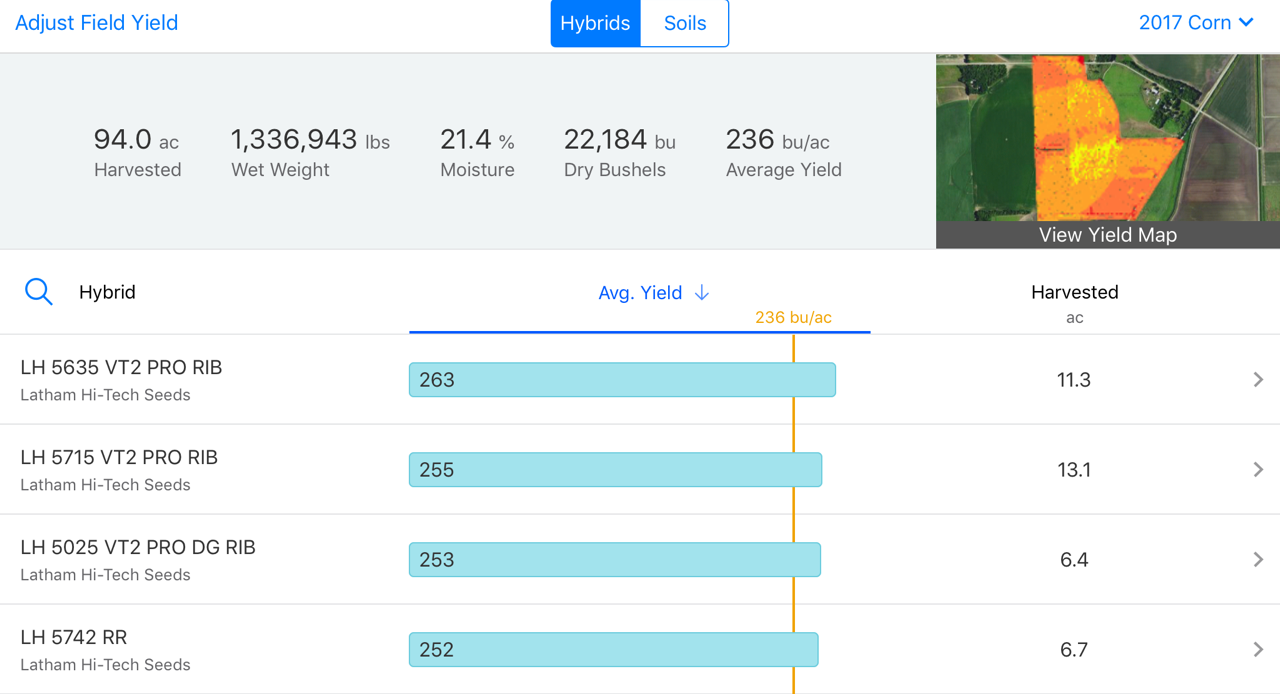
While Climate Fieldview™ (CFV) records hybrids and varieties during spring planting, the real value is shown during harvest time.
The cab app allows you to record, map and send data all at once! If you mapped planting data, you can see “on the go” how particular hybrids and varieties are performing at harvest. You can pull up a hybrid harvest report and compare yields throughout the field. You can also send this report to your trusted advisor, landlord or family member to help with record keeping.
Three of my favorite features are:
- Creating field region reports. This feature allows you to circle an area or draw any shape around an area of a field to track yield. Maybe you did a side-by-side comparison with and without fungicide or with and without a starter fertilizer treatment. You can view a particular hybrid in different soil types without including bias from wet spots.
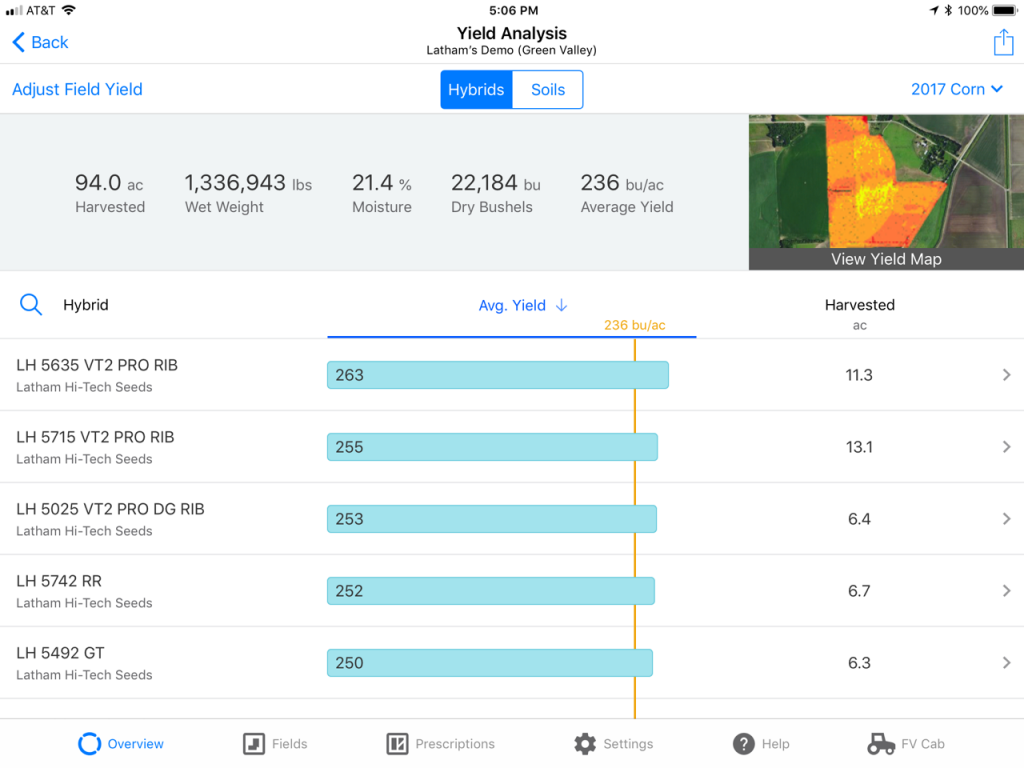
- Calibrating Yield Maps. Sometimes our combine calibration is slightly off, so the scale tickets don’t add up with what was captured by the equipment inside the cab. Using the app, you can easily edit the weight and moisture of the crop that was harvested. This allows for calibration after the fact that will adjust your harvest maps to more accurately represent what came off the field.
- Uploading data on-the-go when you’re running multiple combines in a field. You can instantly see how far another combine has harvested. This requires a data package on your iPad or using your phone as a hotspot, but that’s a small price to pay for the efficiency of coordinating equipment.
The best part is right now farmers have an opportunity to try the CFV platform FREE for a year! (This includes a one-year subscription and hardware. Offer expires Aug. 31, 2019.) This is an excellent opportunity to experience CFV first-hand during harvest. If this is something you’re interested in, feel free to call me for more information.
- Creating field region reports. This feature allows you to circle an area or draw any shape around an area of a field to track yield. Maybe you did a side-by-side comparison with and without fungicide or with and without a starter fertilizer treatment. You can view a particular hybrid in different soil types without including bias from wet spots.
-
Latham Hi‑Tech Seeds
DataForward Leads to Better Product and Placement Decisions

Our focus remains on providing options for our farmers when it comes to our precision ag offerings. Just like we do with the diversity of our product lineup.
For farmers who want to invest their own time into working with their data, we will use the Climate FieldView™ (CFV) Platform to help them uncover valuable resources to better their operations. For farmers who want to benefit from using their data but don’t want to spend their own time organizing and analyzing it, we will use our Data ForwardSM Platform. Both platforms provide excellent opportunities for using farmers’ data. The major difference is that one platform is “farmer led,” and the other is “Latham led.”
Data Forward is the approach we take to help customers use their data to increase profitability and to help them make the best product selections for every acre. We typically meet to discuss the soil types, weed pressure or other challenges in each field, as well as management practices used. Data Forward helps us gain insights from their yield data, which can help us understand each field’s productivity on a deeper level. It also helps us select the best genetics and trait package for each acre.
A key part of our Data Forward program is “Yield Analysis with Insights.” Using planting and yield data, we can analyze yield against many different factors to help with seed placement. One example is looking at yield based on planting date and also using harvested moisture to guide next season’s discussion on particular hybrid maturities and drydown characteristics.
Dealers can encourage their customers, who are using the Data Forward Platform, to conduct their own on-farm experiments. They might be interested in comparing results from soybeans tolerant to Iron Deficiency Chlorosis (IDC) to an in-furrow treatment for IDC, or maybe they’re interested in conducting a hybrid seeding rate study to find the sweet spot for seeding rates on their farm. These are just a couple quick examples. All farmers think about the best ways to manage their unique challenges in each field, and Data Forward provides a way for both you and them to make better placement and product decisions.
Data Forward also encompasses our commitment to the quality for which we stand. We work with farmers to collect the best data by calibrating equipment and programming monitors, so they can accurately track the history in each field. We layer all the data a farmer has available, from planting and soil sampling, to spray and harvest operations. It is one thing to use a yield map to make some changes for the next season, but it’s a much more meaningful tool to build quality data over time. By organizing years of data within each field, we can help a farmer gain insights he or she may have never considered by scouting from the truck or combine windshield.
Data Forward is our approach to helping customers use their data now and to also build that powerful resource for the future. Many farmers may be in the early stages of collecting data, so we want to help them see the benefits of using what they have now. We also want to show them how building their data for a few years can provide valuable insights. We use those data layers to create powerful Management Zones for each field, allowing a farmer to see value from technologies like variable rate seeding or fertility.
Feel free to contact me at the Latham office if you’re interested in learning more! -
Latham Hi‑Tech Seeds
Tests Underway with Climate Nitrogen Advisor

Nitrogen is mobile in air, water or soil. Because nitrogen moves, it’s a challenge for farmers to keep everything in balance while maintaining profitability. That’s probably why we hear so much about “precise nitrogen management.”
It seems like everyday we hear about a different way to best manage nitrogen. Universities have moved from the long accustomed Yield Goal approach to Maximum Return to Nitrogen (MRTN), which links corn and nitrogen prices to calculate the best nitrogen rate based on years of data. The objective is to provide a yield increase that will pay for the cost of the nitrogen. Another nitrogen management method involves applying some nitrogen before planting to get the corn started. Then soil or plant tissue samples are taken to determine plant nitrogen levels and to estimate how much nitrogen will be available in the soil for the remainder of the season.
Yet another nitrogen management tool is sensor technology, which uses artificial light to capture on-the-go leaf reflectance and translates that into values to calculate a product rate for on the-go nitrogen side-dress applications. The Nitrogen Advisor tool available through the Climate FieldView™ (CFV) platform combines extensive weather data with rainfall and temperature information to understand leaching, volatilization or other ways nitrogen may be lost based on timing of application, product being applied, and rates being applied. This sounds very familiar to the 4 R’s of nutrient management: Right Rate, Right Source, Right Placement, and Right Timing.
The CFV Nitrogen Advisor is based on a model that has been extensively researched throughout the Midwest. Last winter the Iowa Soybean Association released its research, which included replicated trials using the CFV Nitrogen Advisor. Cooperating farmers across Iowa ran the CFV Nitrogen Advisor and used their own personal nitrogen rates as the check. They compared their rates with both adding and decreasing rates of 40 lbs/acre of nitrogen. Nitrogen Advisor topped 7 of the 10 trials, and in some of these trials, it led to $20/acre profit! Where Nitrogen Advisor wasn’t on top, it was within $10/acre in terms of profit of the top performer.
When profit margins are tight, we’re all extremely interested in getting the best return on our investment. Nitrogen is where we spend most of our fertility budget; we’re experimenting on the Latham Research Farm with the Climate Nitrogen Advisor this season. I invite you to attend our fall field day in Alexander where you will be able to walk through the plot. We’ll also be sharing research results at our post-harvest meetings this fall.
-
Latham Hi‑Tech Seeds
Tests Underway with Climate Nitrogen Advisor
Nitrogen is mobile in air, water or soil. Because nitrogen moves, it’s a challenge for farmers to keep everything in balance while maintaining profitability. That’s probably why we hear so much about “precise nitrogen management.”
It seems like everyday we hear about a different way to best manage nitrogen. Universities have moved from the long accustomed Yield Goal approach to Maximum Return to Nitrogen (MRTN), which links corn and nitrogen prices to calculate the best nitrogen rate based on years of data. The objective is to provide a yield increase that will pay for the cost of the nitrogen. Another nitrogen management method involves applying some nitrogen before planting to get the corn started. Then soil or plant tissue samples are taken to determine plant nitrogen levels and to estimate how much nitrogen will be available in the soil for the remainder of the season.
Yet another nitrogen management tool is sensor technology, which uses artificial light to capture on-the-go leaf reflectance and translates that into values to calculate a product rate for on the-go nitrogen side-dress applications. The Nitrogen Advisor tool available through the Climate FieldView™ (CFV) platform combines extensive weather data with rainfall and temperature information to understand leaching, volatilization or other ways nitrogen may be lost based on timing of application, product being applied, and rates being applied. This sounds very familiar to the 4 R’s of nutrient management: Right Rate, Right Source, Right Placement, and Right Timing.
The CFV Nitrogen Advisor is based on a model that has been extensively researched throughout the Midwest. Last winter the Iowa Soybean Association released its research, which included replicated trials using the CFV Nitrogen Advisor. Cooperating farmers across Iowa ran the CFV Nitrogen Advisor and used their own personal nitrogen rates as the check. They compared their rates with both adding and decreasing rates of 40 lbs/acre of nitrogen. Nitrogen Advisor topped 7 of the 10 trials, and in some of these trials, it led to $20/acre profit! Where Nitrogen Advisor wasn’t on top, it was within $10/acre in terms of profit of the top performer.
When profit margins are tight, we’re all extremely interested in getting the best return on our investment. Nitrogen is where we spend most of our fertility budget; we’re experimenting on the Latham Research Farm with the Climate Nitrogen Advisor this season. I invite you to attend our fall field day in Alexander where you will be able to walk through the plot. We’ll also be sharing research results at our post-harvest meetings this fall.
-
Latham Hi‑Tech Seeds
Ways to Benefit from the Climate FieldView™ Cab App

“Hindsight is 20/20” is a phrase what we’ve all used. If we’re using our precision technology in the tractor cab, however, it’s a phrase that we shouldn’t have to use at planting time.
The Climate Fieldview™ (CFV) Cab App allows you to see everything that’s happening during planting, so you can decrease the number of issues you will have to re-live during harvest. Having Climate FieldView software in the cab is so beneficial. On most monitors, you can typically see planting population, seed spacing, doubles and skips, and downforce. Depending on your planter and planter monitor, you may see a few more or a few less diagnostic readouts. The one thing missing is the map unless you have CFV’s Cab App.
Using the CFV Cab App, you can see different readouts in a map form on an iPad. It’s extremely helpful to see color changes, but the CFV Cab App has much more power and function than just a few color maps. For those of us who like to analyze in real-time to make sure we’re making the most of the current planting season, a planting summary
report shows how many acres of each hybrid or variety has been planted. It also tells you the number of acres you have planted, so you can calculate the amount of seed needed to finish that field.Another benefit of the CVF Cab App is that you can drop a pin in a spot where you noticed a tile blowout or a hard spot in the field that needs some extra tillage next fall. You can also create on-farm tests on the fly with the Cab App. You may see a spot in the field that you want to monitor; simply draw a “field region” polygon around that spot. You’ll get yield analysis specifically within that area, so you can watch it throughout the season.
Also remember to input starter fertilizer or seed treatments in the CVF Cab App. If you’re applying a little extra, track those areas and see if you get a return. You also can map seed treatments that were applied to each variety/hybrid. On the starter fertilizer side, the CFV platform allows you to write a variable rate starter fertilizer prescription to match various populations within a field.
One final valuable feature of the CFV Cab App that I’ll cover here is the ability to send a summary or quick report with a map. You can send a map to your crop adviser or your landlord to keep them updated and/or engaged in what you’re doing. You even have the ability for a split-screen view, so you can place a soil map next to your population map. Doing so may help you make changes on the fly.
There are more valuable features in the CFV Cab App than I can mention in one article. If this is something that could benefit your operation or your customers’ operations, give me a call. I’ll gladly sit down and look at how the CFV Cab App could be used to benefit your particular situation and operation.
-
Latham Hi‑Tech Seeds
How to Troubleshoot Issues with Precision Ag Equipment

Technology is so exciting when your prescription file (Rx) uploads to the monitor, when your planter runs smoothly, and when planting rates change by zone.
The primary reason we implement new technology is for convenience. However, there are few things more frustrating than not being able to reach tech support when you have an issue with your precision ag software or hardware. That’s why in this article we’re providing you with a list of resources to help resolve issues that might arise.
Your equipment dealer should be your first call if he or she sold you precision ag monitors or hardware for your equipment. They can typically walk through some diagnostics over the phone. Climate FieldView™ (CFV) also has an excellent staff on call at 1-888-924-7475. These staff members are trained to diagnose issues with CFV and the Cab Drive, as well as how to navigate through different monitors.
Smartphones are another useful resource. Climate has excellent resources online, including a YouTube channel with “how to” videos that demonstrate how to import and export data. These videos also demonstrate other important tasks for planting season. In addition, Climate’s “Knowledge Center” is the best place to find helpful videos, information, and PDF reports that you can print and keep in the tractor cab for future reference.
Another unique feature of the CFV platform is the “remote view,” which allows you to give permission for someone to see your iPad screen and troubleshoot in real time. This could help you diagnose a planter problem, such as issues with singulation or seed spacing. Remote View also may be used to load Rx planting file. Another benefit of this feature is that someone can see the field where you’re working and how much ground you have left, so he or she knows when to bring seed to the next field.
Unless your precision ag equipment is working properly, the value is lost. Sometimes farmers decide to keep planting without taking the time to record the data or without making the time to ensure the data is being properly recorded. Remember, the data you’re collecting can only bring so much value to your operation. Garbage in equals garbage out!
Think of precision ag equipment like the other equipment you fix on your farm. The technology in your cab is really another tool that can provide you with valuable insight. If you are interested in understanding how your data can impact your bottom line, call your Latham RSM to schedule a Cab Drive demo this spring in your planter.
-
Latham Hi‑Tech Seeds
Begin with Basics to Build Precision Ag Platform

Yield monitors, fancy sensors, and imagery tend to receive the “oohs and aahs” when it comes to precision ag technology. But is that what matters most?
For those who are just starting to use precision ag technology, it’s best to begin with the basics. Climate FieldView™ puts very valuable layers of data right at your finger tips to help make decisions that directly impact your bottom-line.
Fertility should be the base of any crop production system because soil sampling gives your crops the best chance for success. Using the Climate FieldView app, you can pull in your soil sampling data. Use the split-screen tool to view the soil sampling side-by-side with yield data to diagnose season-long problems; or view it beside satellite imagery during the season to make critical last-minute application decisions (see image). You can even use it side-by-side while planting to make last-minute population adjustments based on areas you know have lower fertility.
Soil pH and liming is the foundational piece of the puzzle that can significantly impact how well the other fertilizers and herbicides you apply are getting used by crops. You can apply variable rates of nitrogen (N), phosphorus (P) and potassium (K) and seed. Unless the pH is correct, many of those
applications will be a wash in terms of yield impact. For example, once the soil pH drops below
5.8, soybean nodulation for nitrogen fixation significantly decreases and causes that yellow
soybean look to linger longer and lower yield. If your corn is growing in soils with a pH below 5.5, phosphorus availability takes a nose dive. Phosphorus is critical for yield as it is involved in photosynthesis, respiration, energy reactions, and many other important processes.In regions of Latham Country, farmers struggle more with high pH and the ability to bring it down into that preferred range of 6.0 to 7.0. It’s not economically feasible to attempt lowering pH for large scale production, but having this data at your fingertips can guide you to those areas where you may need for focus on more tolerant crops such as Latham® IRONCLAD™ soybeans. You also can monitor those areas for rescue applications of certain micro-nutrients. In addition, you can apply variable rates of N, P, K fertilizers that include Sulfur, Zinc, or other nutrients to meet a particular crop’s demands in higher-yielding areas.
Whatever the case may be for your specific field, the soil database layers within the Climate FieldView App can help with everything from planning during these winter months to inseason
diagnosis. A pretty yield map can be a real attentiongetter, but when you link your yield map with fertility, it takes FieldXFieldSM crop planning to the next level. By using precision ag tools, you can be confident you’re giving top-yielding Latham genetics the best chance of success! -
Latham Hi‑Tech Seeds
Podcast: Breaking the Cost Barriers to Precision Ag Technology
Tune in as Phil discusses breaking the cost barriers to using precision ag technology. Share your #AsktheAgronomist questions with us on social media and we will answer them on Thursday morning!
