To save the most money on inputs, we must plan earlier and earlier every year. A current soil test is the best way to evaluate your fertility and ultimately your yield potential. Besides the normal evaluation of the main nutrients, a soil test pays for itself.
Let’s look at three ways to use your soil test to its full potential:
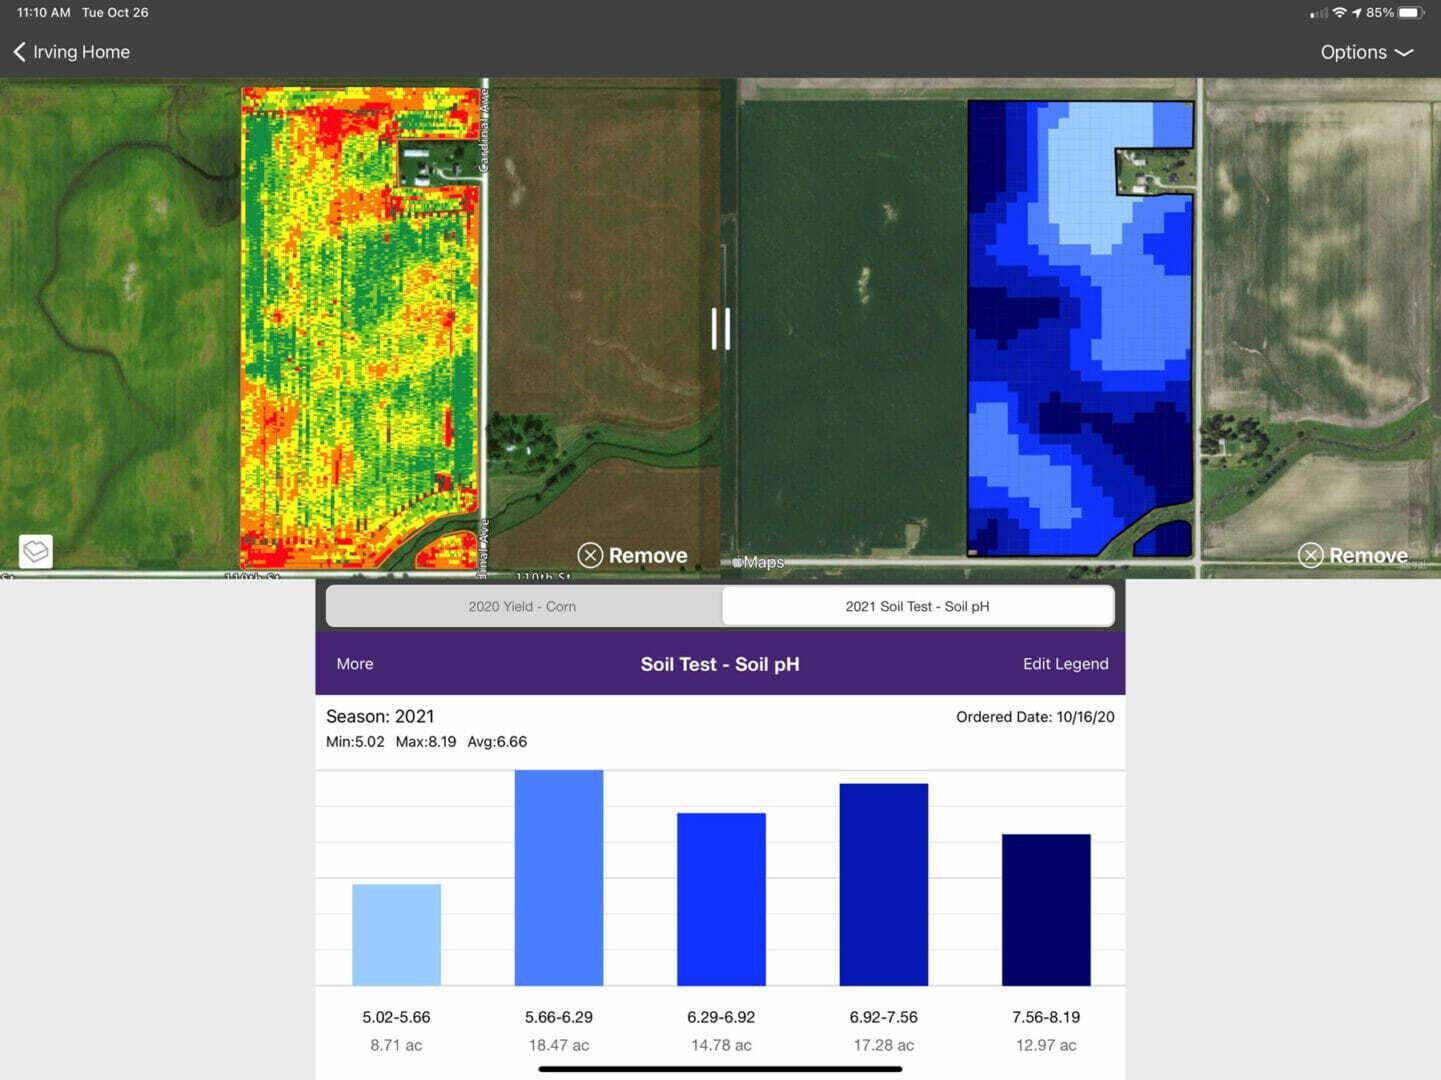
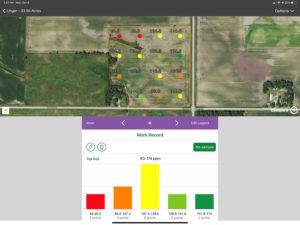
- Soil pH matters in more ways than lime. We typically look at pH maps to understand nutrient availability, but let’s think in terms of input planning. Take soybeans and a pH map, for example. By looking at this one map you will better understand the areas of high pH, so you can select a Latham® IRONCLADTM variety to stand up to challenges from Iron Deficiency Chlorosis (IDC). Another great use for this map is herbicide applications. Herbicide carryover in high pH spots can impact soybean yields. This map potentially can help make the decision to change a crop rotation or herbicide program to save yield losses.
- Organic Matter is king. Do you have organic matter (OM) readings higher than 5% and below 2% in the same field? Couple this with yield and this is a great start to help apply nitrogen more accurately. Another great combination is OM beside soil type map. Look at Latham Seeds’ product guide while you’re looking at these maps to quickly determine what percent of each field would benefit more from defensive traits or offensive traits. Really high OM soils typically hold more water and have challenges like flooding and higher disease potential. Also notice how much higher your potassium (P) and phosphorus (K) levels are in these spots.
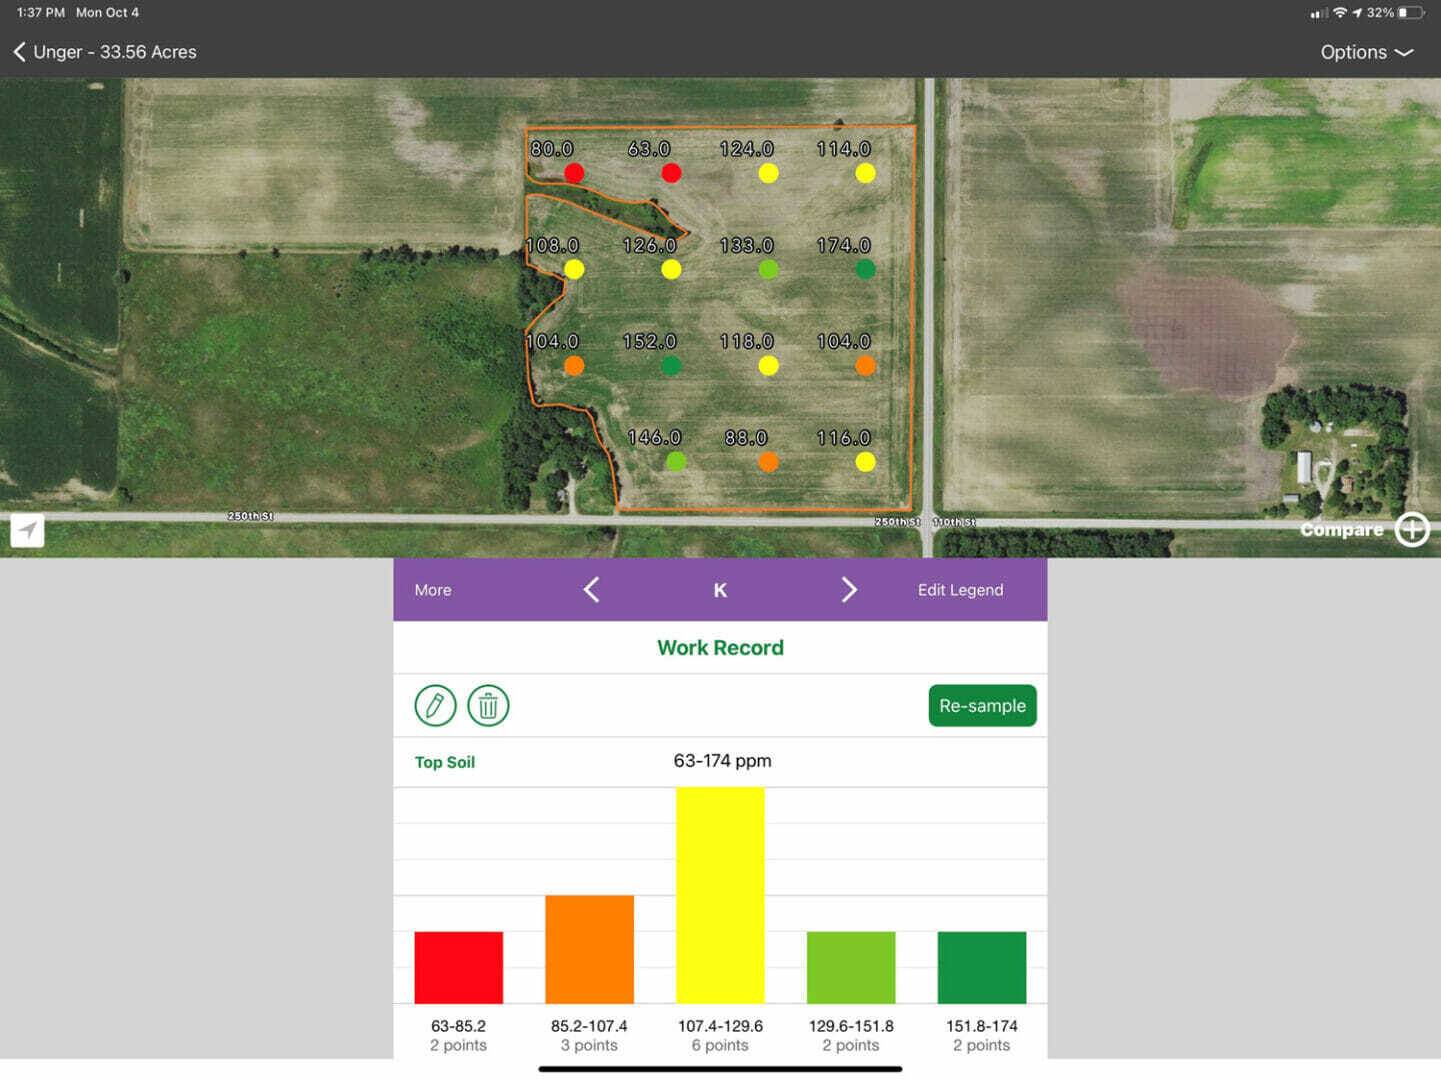
- When phosphorus levels are high, other nutrients are lacking. Many farmers use animal manure as a source of fertilizer. This is great because it provides most of the essential nutrients our crops need, however, manure can have higher levels of some nutrients including phosphorus. If your soil potassium levels are climbing, move manure applications to another field. Also pay attention to other nutrients that suffer when potassium increase. If you notice your P levels are high, then Sulfur (S) and Zinc (Zn) could be at a disadvantage. Both S and Zn can be less available to the plant as P levels climb. This may not be visually noticeable at first, but it will show up in growth and yield if you do a side by side with S and Zn fertilizer.
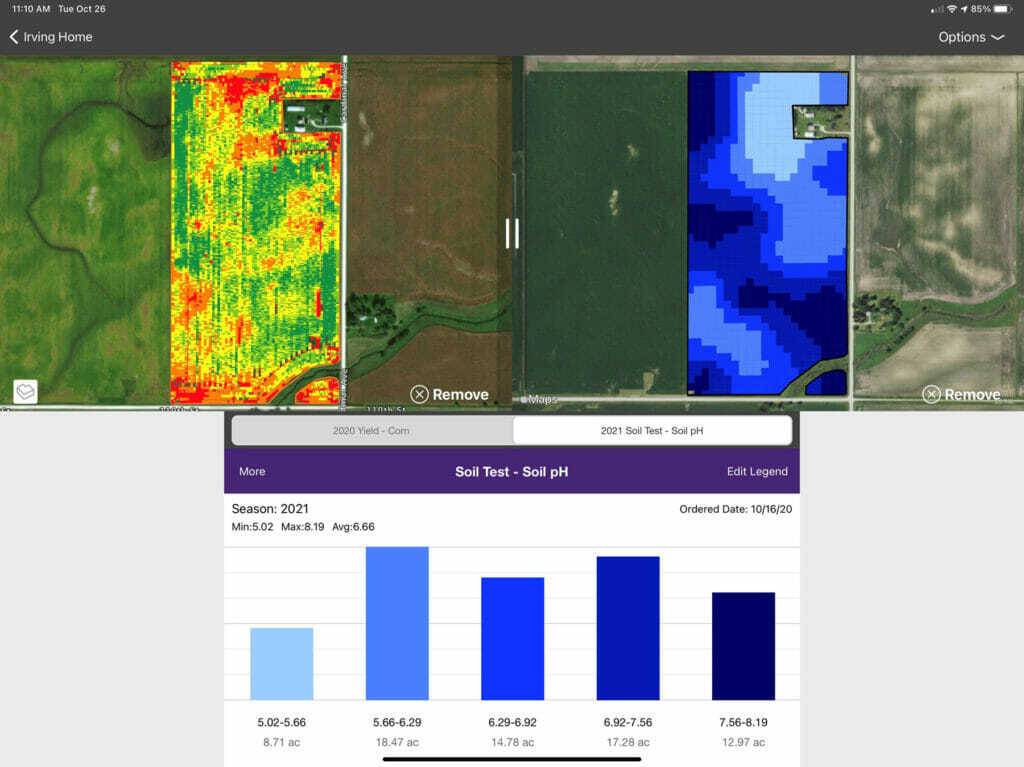 These comparisons and maps can be done in Latham’s Data ForwardTM app with a simple soil sample taken and yield map to start seeing value out of the information that you capture every year. If you’d like to learn how to start putting these things to work on your farm give me a call!


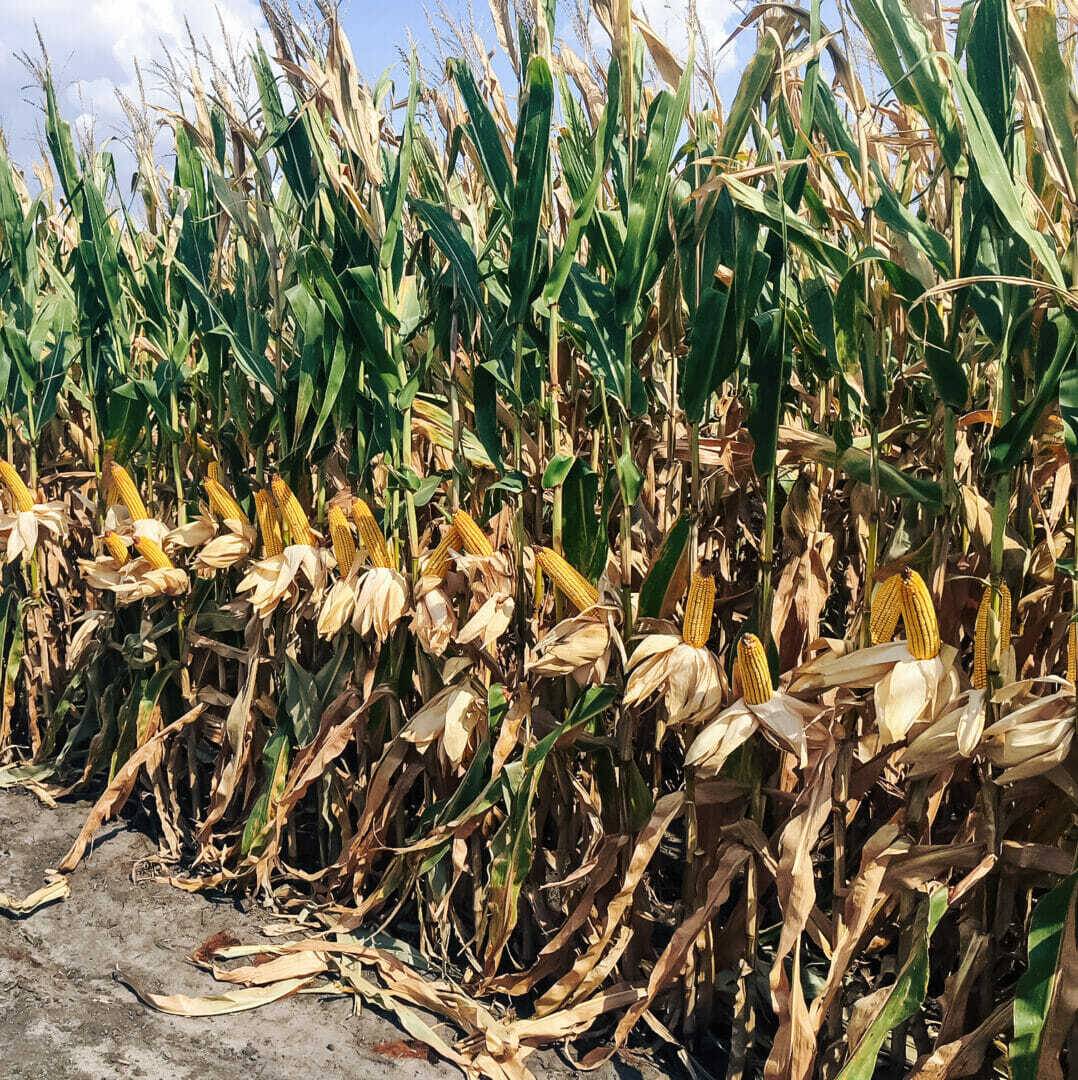
 As Harvest 2021 gets underway, we will start our morning checks to see which fields should be prioritized for harvest. Hybrid maturity helps guide us to certain fields, but sometimes a field stands out for another reason like late-season stalk lodging.
